That “random” spike on your electric bill usually has a reason. One family I know saw their costs jump after months of calm. They assumed it was the weather. Then they started tracking energy usage over time, and the culprit showed up clearly.
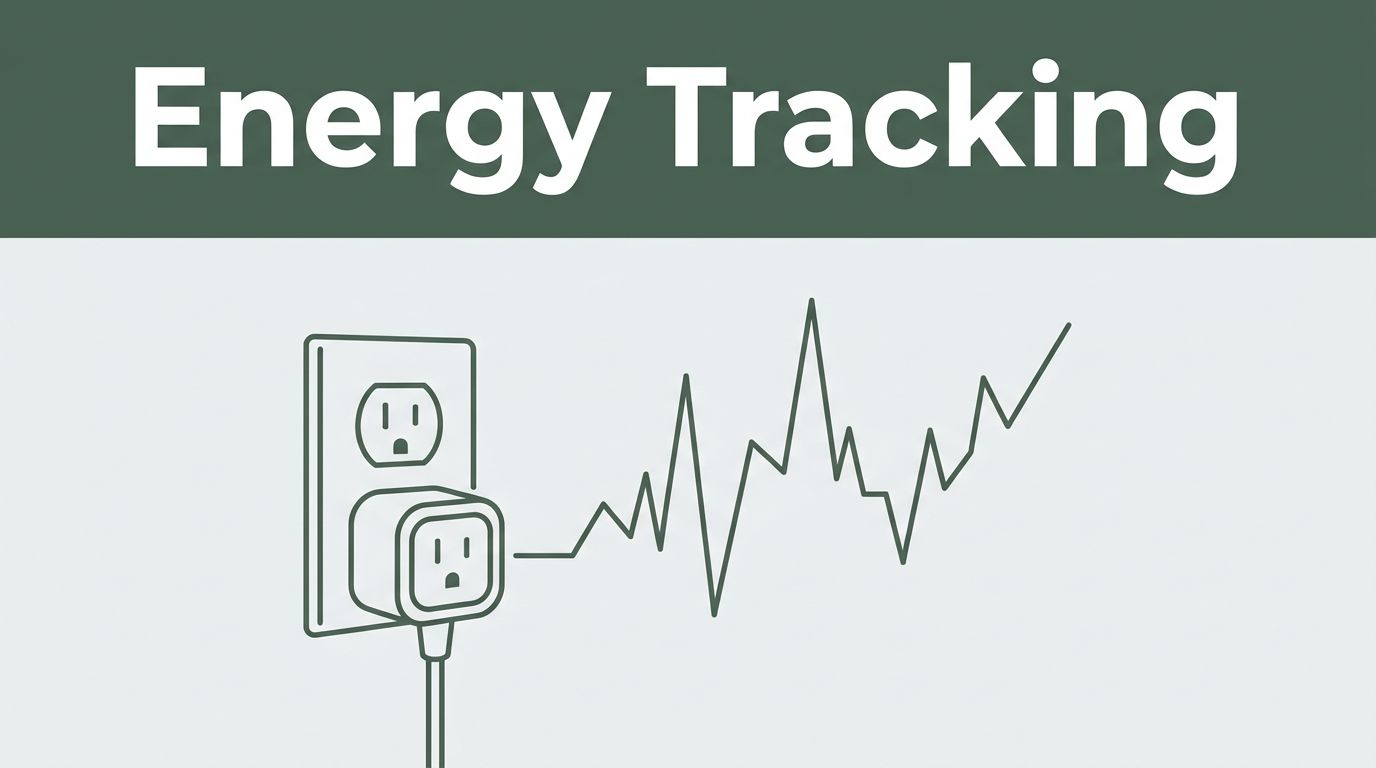
Home energy monitoring turns vague monthly numbers into patterns you can act on. Instead of guessing, you can see which days run hot, which appliances spike, and when your peak usage happens. Over time, tracking also helps you spot repeat problems, like a failing fridge seal or standby power that never shuts off.
Short-term checks help too, but they miss the story. One afternoon of data won’t show summer air-conditioning cycles. One “good week” won’t reveal a late-night device habit. Monitoring for weeks (or months) gives you a baseline, then proves whether your changes work.
In the steps ahead, you’ll learn how to set up home energy monitoring with whole-home monitors, smart plugs, and apps. You’ll also see which 2026 options are worth considering, from Emporia to Sense. Finally, you’ll learn how to read charts like a pro, so you can find waste and keep saving.
Why Tracking Energy Over Time Changes Everything for Your Wallet and Planet
If you only look at your bill once a month, you’re basically reading a crime report after the event. Tracking energy usage over time gives you the timeline. Then you can catch the pattern before it repeats.
For many households, electricity use averages around 10,500 kWh per year. When you track consistently, most people find savings by uncovering wasted power and fixing habits. In plain terms, tracking can often lead to $200+ per year when it helps you cut 5% to 15% through real changes.
Here’s what long-term monitoring makes easier:
- Find power vampires: Old fridges, failing HVAC parts, and “phantom” standby loads can add up.
- Spot peak usage times: Your home might spike in the evening, or it might climb steadily during hot afternoons.
- Measure improvements you can trust: You’ll know if LED bulbs helped, or if unplugging something actually mattered.
- Repeat wins: When you see the same spike every week, you can stop chasing guesses.
A simple example helps. Let’s say you replace bulbs and feel hopeful. With tracking, you can compare the same weeks before and after. If your lighting spike drops, you keep doing what works. If it doesn’t, you move on to the next likely cause.
Tracking can also help the planet in a real way. When you reduce wasted energy, you cut your carbon footprint too. It’s not just feel-good. It’s less fuel burned to make the electricity you don’t need.
Below is a quick way to think about common energy “leaks” and what to look for.
| Possible waste | What tracking usually shows | What to do |
|---|---|---|
| Standby power | Small, steady draw when “everything is off” | Unplug, switch to smart power strips, or identify devices |
| A hard-to-spot appliance | Repeating spikes on certain days | Look for spikes at the same times, then test one change |
| HVAC inefficiency | Summer and winter peaks that grow | Check runtime, filters, settings, and sealing |
| Laundry or EV charging habits | Clear spikes tied to laundry or charging | Shift usage, use timers, and confirm the change worked |
The biggest advantage is clarity. You stop wondering, and you start knowing.
Choose the Best Energy Trackers for Your Home Setup in 2026
The best home energy monitors 2026 aren’t the most expensive ones. They’re the ones that match your home, your budget, and your patience for setup.
Start with this question: do you want whole-home energy monitoring, or do you want to hunt one appliance at a time? Whole-home monitors give the big picture. Smart plugs narrow in. Apps can help you begin, even without hardware.
Whole-Home Monitors That Reveal Every Circuit’s Secrets
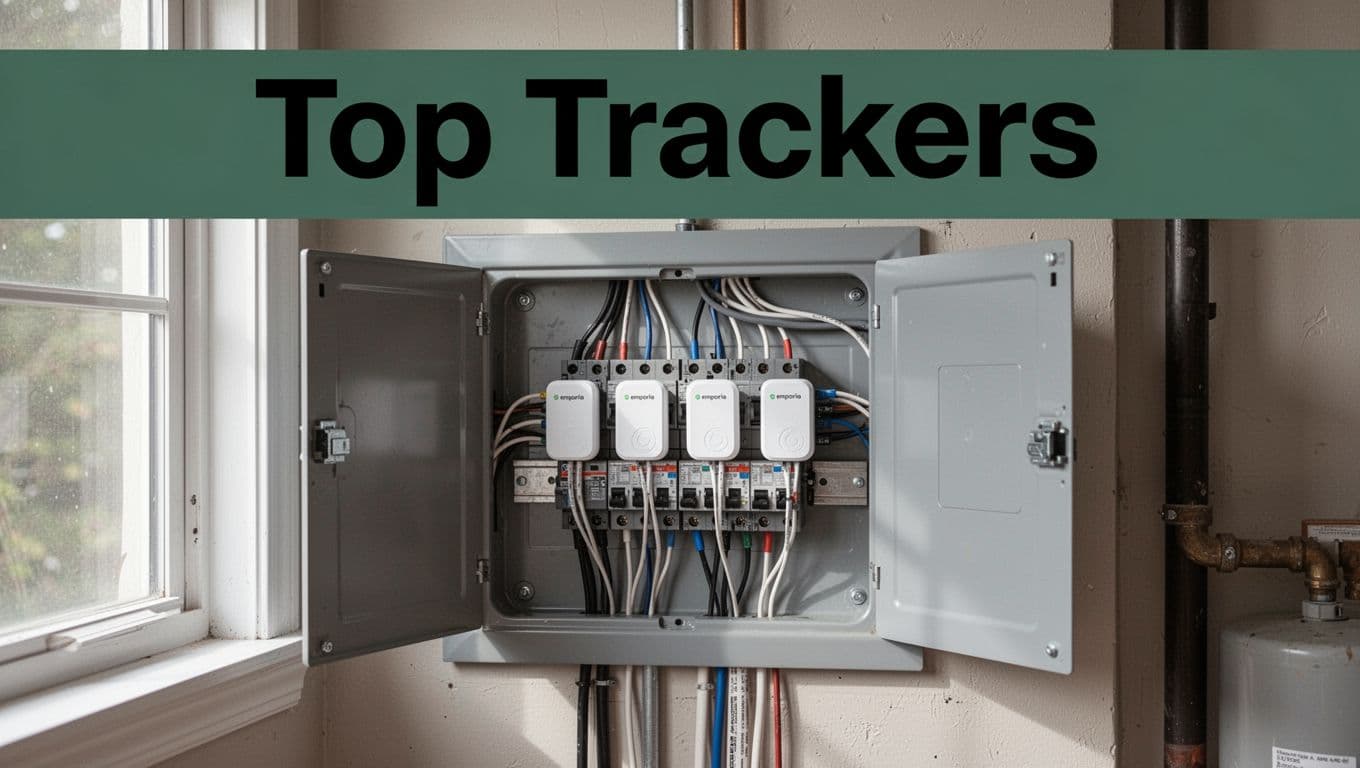
Whole-home monitors are the fastest path to “where is my power going?” They connect to your electrical panel, then estimate usage across circuits.
Emporia Vue Gen 2 / Vue 3 is a top pick for many homeowners because it’s detailed and generally good value. It supports circuit-level tracking, real-time insight, and alerts. If you want to understand the wiring idea behind it, read how the Vue energy monitor works to get a feel for the setup.
Sense also tracks from one main point, then uses learning to identify devices. The big win is less manual work. Instead of placing sensors on every circuit, Sense tries to learn what your appliances do over time. That said, it can be less specific than a circuit monitor when it comes to breaker-level detail.
For deeper integration options, Siemens Inhab and Schneider Wiser can fit people who already want smart-home notifications or solar-friendly setups. Aeotec is a strong choice if you prefer Z-Wave devices and want a more “smart home first” style of monitoring.
For an outside look at the Emporia Vue Gen 2, check TechHive’s Emporia Gen 2 review. It’s useful for comparing ease of use and what people notice once the app is running.
When whole-home tracking “clicks,” you usually see it in your graphs. You’ll spot HVAC runtime, laundry spikes, and those mysterious evening surges.
Smart Plugs and Sensors for Laser-Focused Appliance Tracking
If your goal is to solve a specific problem, smart plugs can be simpler. They’re great for renters, or for homeowners who don’t want panel work right away.
Vivint smart plugs work well for targeted devices like TVs, dehumidifiers, or older appliances you suspect. You can often schedule “off” times and watch usage patterns by device.
Voltaware is known for a different approach. Instead of tracking everything, it focuses on showing what’s drawing power and flagging changes. That can help you catch a problem without building a long DIY wiring project.
Use smart plugs when you already have a suspect list. For example:
- You keep leaving a kitchen appliance running.
- A guest room always seems to add cost.
- Your fridge cycles more than it should.
Then track for two or three weeks to confirm. With plugs, you can do quick A/B tests, like “same days, unplug this, compare usage.”
The main tradeoff is scope. Smart plugs won’t show your entire home. They show what you plug in.
Apps to Track Without Buying Hardware
If you want to start now, apps can help you build a baseline. Some people also pair apps with utility-provided data sources.
For example, the Emporia app gives clear visuals once hardware is set up, with daily and monthly views that help you compare changes. You can explore the app experience at Emporia App: Your home energy, intelligently managed.
Apps alone can be less precise. Many require manual entry of devices or rely on utility rate information. Still, they’re useful for beginners because they help you ask better questions.
A practical approach:
- Start with an app or utility portal.
- Track for a few weeks.
- Then upgrade to a whole-home monitor if you still feel stuck.
It’s like using a flashlight to find the right room before you buy the right tools.
Set Up Your Energy Tracker Fast and See Results Right Away
Setup is where many people lose motivation. Keep it simple, and you’ll get results faster.
Here’s a safe, beginner-friendly flow. You’ll still want to follow each product’s instructions, but the order matters.
- Pick your tool type
Whole-home monitor for broad insight. Smart plugs for specific devices. App-only for starter data. - Install (panel or plug)
Panel installs may require an electrician, depending on your comfort and the monitor’s wiring needs. - Download the app
Sign in, then connect your device when the app prompts you. - Connect Wi-Fi or Bluetooth
Place your hub where the signal stays stable. - Label what you can
Name circuits, or list appliances you plan to test. - View data, then confirm a “known event”
Run laundry or turn off a device. Your charts should reflect it.
A common mistake is waiting too long to label devices. If you don’t label, the graphs turn into a puzzle you’ll avoid.
Also, don’t underestimate Wi-Fi drops. If your data looks jumpy, restart the connection and check distance. If the app supports alerts for connectivity, turn them on.
Safety first, especially around panels. If you’re unsure, hire a licensed electrician.
Once you see steady charts for at least a week, you’re ready for the next step: analysis.
Analyze Your Data to Spot Waste and Build Saving Habits
Tracking only works if you review it. Otherwise, your monitor becomes another screen you ignore.
Think of your data like weather. One sunny day means nothing. But a pattern over weeks tells you what to expect.
Start by building a baseline. Look at your typical daily use and your typical monthly total. Then ask: when does your home spike, and what changed around those times?
Next, set a simple goal. Many people aim to cut 15% at first, then adjust based on reality. It’s okay if your first month saves less. You’re learning your home.
Sense and Emporia-style tools often help by showing device candidates or circuit patterns. Still, you should confirm with real changes.
Here are solid, low-drama habits to test:
- Swap one behavior (unplug, timer, change thermostat range).
- Measure for at least two weeks.
- Compare before and after, using the same season if possible.
Two real-world examples show why this works. First, a dryer can create strong spikes because of both heat and motor load. Second, EV charging might quietly add cost if it runs whenever it finishes, not when rates are lower. Tracking helps you time it.
Hunt Down Peak Usage Times and Power Hogs
Now focus on peaks. Check your daily charts for the biggest jumps. Then look for repeated spikes at the same hours.
Maybe your biggest peak hits around 6 to 9 p.m. That often points to cooking, laundry, or gaming setups. Maybe it climbs during late afternoons. That often points to AC runtime.
The key is repetition. Waste shows up again and again.
Also watch for seasonal drift. If your base load rises every summer, something may be running longer. If your winter peaks creep, it might be HVAC or heating schedules.
Set Goals and Watch Your Progress Grow
Once you spot your top few causes, you can make saving feel less random.
Set a “baseline then improve” rhythm:
- Pick one target (standby power, HVAC runtime, or EV charging time).
- Test one change.
- Review monthly totals and a weekly chart.
In addition, celebrate small wins. Even a $50 difference feels real. It also keeps you motivated to keep going.
If you have smart devices, you can automate your tests too. For instance, some monitoring setups integrate with thermostats, making it easier to compare “heating schedule” changes with your power graph.
And if you run a Nest thermostat, Emporia users can connect it with the Emporia app via your Nest thermostat now works with the Emporia app.
Conclusion
Your electric bill feels like a mystery until you track energy usage over time. Once you monitor consistently, the spikes stop being random, and they start pointing to real causes.
Whole-home monitors show the big picture. Smart plugs help you confirm suspects. Apps can get you started while you build confidence. Most importantly, long-term charts let you prove what changed and what savings stuck.
Pick one tracker type this week, then set it up. After that, review your graphs every few days, and do a deeper check monthly.
If your goal is simple, it’s this: stop guessing, start measuring, and let your home’s patterns guide your next move. After all, your best savings often come from the waste you finally see.